MonitEasy | AI-Powered IoT Monitoring for Transformers, Solar, Wind & Industrial Assets
Energy Management · IoT Analytics

MonitEasy EMARS
Energy Management,
Analysis & Recommendation powered by MonitEasy intelligence

Smart IoT-based EMARS platform for real-time industrial energy monitoring, optimization, and data-driven recommendations — designed to help identify meaningful energy savings across your facility.

Real-TimeIoT Monitoring
Up to 40%Potential Savings*
24 × 7Minute-by-minute
99.9% UptimeAWS Cloud

MonitEasy EMARS (Energy Management, Analysis & Recommendation System) is an IoT platform that monitors electricity, gas and water consumption in real time, identifies inefficiencies through analytics, and surfaces actionable savings recommendations via a unified dashboard. It is designed for industrial facilities, factories and commercial buildings with multiple energy meters.

Key Facts

EMARS at a glance

Who it's for
Factories, industrial plants, and commercial buildings with multiple electricity, gas or water meters that need a single consolidated energy view.
Problems it solves
Fragmented per-meter data, unnoticed energy wastage, lack of evidence for ROI on savings measures, and slow manual M&V reporting.
Utilities monitored
Electricity, gas and water, tracked simultaneously through connected IoT-enabled meters on a single dashboard.
Communication protocol
MODBUS, RS485 and TCP, with a MonitEasy IoT gateway transmitting data to the cloud via 4G, Wi-Fi or Ethernet.
Deployment model
Connects to existing or newly installed IoT-enabled meters; integrates with existing BMS/SCADA systems rather than requiring full replacement.
Alert & reporting
SMS and email alerts to designated stakeholders, plus auto-generated monthly Measurement & Verification (M&V) reports.
About EMARS

Energy Management, Analysis & Recommendation System

MonitEasy EMARS is a Smart IoT-based Energy Management System designed to support industrial energy monitoring and optimization. This system provides a comprehensive platform that allows factories to monitor and display all connected energy meters through a single, real-time MonitEasy dashboard.

With IoT power monitoring technology, EMARS offers insights into your plant's energy distribution and consumption. It helps your maintenance and energy teams understand real-time and historical power usage across every machine and section of the facility — enabling data-driven energy optimization and improved operational efficiency.

By visualizing energy consumption patterns through real-time analytics, EMARS is designed to identify inefficiencies, highlight energy wastage, and help you implement corrective measures — supporting cost savings and a reduced carbon footprint.

40%
Potential energy savings identified*
through smart analytics
Real-Time Monitoring Cloud Analytics Mobile Access Sustainability M&V Reports Recommendations
MonitEasy EMARS dashboard showing real-time energy consumption across meters
300+Customers
1000+Meters
40%Avg. Savings*
0+
Satisfied Customers
0+
Meters Installed
40%
Avg. Energy Savings*
24×7
Continuous Monitoring

*Aggregated figures from MonitEasy customer deployments; results vary by facility. Methodology available on request — see case studies.

System Architecture

Smart Energy Management Architecture

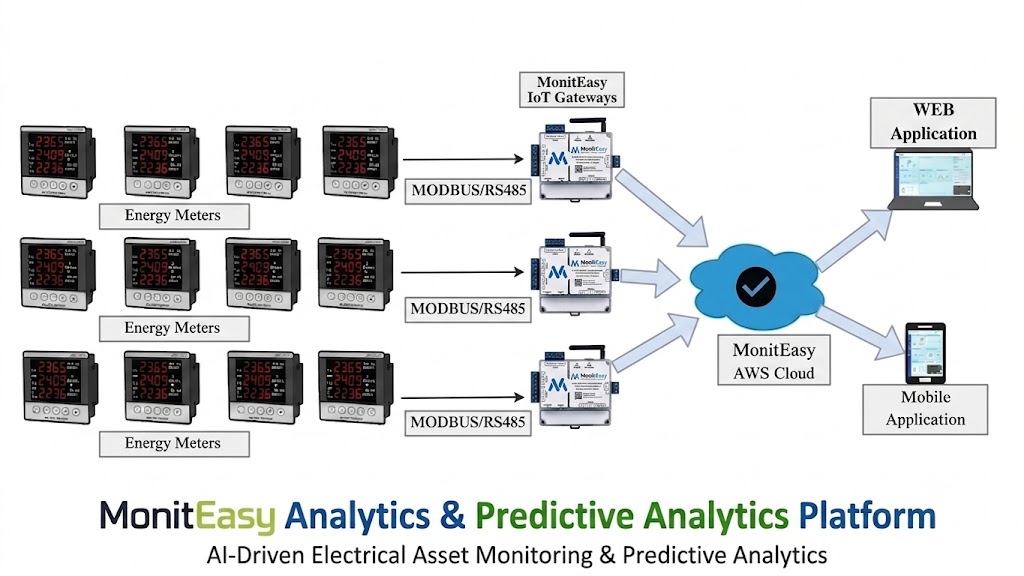
Complete IoT-based EMARS architecture — multi-meter data collection, MonitEasy gateway integration, and AWS cloud analytics for comprehensive energy management.

IoT-Enabled Meters

Data Collection Points

MonitEasy IoT Gateway

Data Aggregation Hub

MonitEasy AWS Cloud

Processing & Analytics

Multi-Platform Access

Web & Mobile Apps

Diagram of the MonitEasy EMARS IoT architecture, from meters through the gateway to the AWS cloud and dashboard
MonitEasy EMARS architecture: meters → IoT gateway → AWS cloud → dashboard.

IoT-Enabled Meters

Multiple energy meters connected via MODBUS/RS485 protocol for seamless data collection and transmission across all facility sections.

MODBUS / RS485

MonitEasy IoT Gateway

Bridges field devices with cloud infrastructure for reliable, low-latency data transmission via 4G/Wi-Fi/Ethernet.

Edge Computing

MonitEasy AWS Cloud

Secure cloud platform for data processing, analytics, and long-term storage with an AWS-backed uptime target and end-to-end encryption.

AWS Cloud

Multi-Platform Access

Access your energy data through web and mobile apps — monitor, analyze, and act from anywhere, anytime, on any device.

Web & Mobile
EMS Capabilities

Energy Monitoring System
Features

Ten capabilities that make EMARS a comprehensive energy management platform for industrial facilities.

01

Easily Identify Saving Opportunities

Identify potential savings of up to 40% through efficient energy management. MonitEasy's analytics pinpoint high-impact areas for corrective action.

40% PotentialData-DrivenEfficiency
02

Class-Leading Energy Monitoring Solutions

Comprehensive energy monitoring benchmarked against industry practice and continuously updated with the latest analytics models.

Industry-BestCutting-Edge
03

Real-Time Monitoring

Monitor energy consumption and usage in real-time for prompt, informed decision-making. Instant alerts notify the right stakeholders the moment anomalies are detected.

Live DashboardInstant Alerts
04

Multi-Channel Metering Hardware

Hardware capable of monitoring multiple channels simultaneously — track every machine, section, and sub-circuit without gaps or blind spots.

Multi-ChannelSimultaneous
05

Multi-Source Monitoring

Monitor gas, electricity, and water usage simultaneously for holistic energy management across your entire facility — a single-pane-of-glass experience.

GasElectricityWater
06

Integration with Existing Building Engineering Systems

Integrates with your current BMS, SCADA, and building engineering systems — designed for minimal disruption to existing operations.

BMSSCADAIntegration-Ready
07

Remote Monitoring

Monitor energy usage remotely from any device, anywhere. Secure cloud connectivity keeps your energy data accessible when you need it most.

Remote AccessAny Device
08

Configurable and Programmable Hardware

Customize and program hardware components to suit specific monitoring needs — scalable from a single sub-meter to thousands of points across multiple sites.

FlexibleScalable
09

Measurement & Verification Opportunities

Verify energy-saving measures through measurement and analysis. Auto-generated M&V reports help demonstrate ROI to stakeholders and management.

M&V ReportsROI Validation
10

24×7 Minute-by-Minute Monitoring

Continuous monitoring of energy usage with minute-by-minute updates — 24×7×365, aiming for no data gaps and no missed events.

24×7×365Continuous
Energy Awareness

Energy Wastage & Awareness

30%
Energy commonly represents a significant share — often cited around 30% — of running costs for industrial, enterprise and commercial spaces.

Electricity costs impact your business's financial bottom line — so whenever you save energy within your business you are also saving money and improving margins.

Real-time energy monitoring gives you the information needed to make informed decisions while reducing consumption and cost across every section.

MonitEasy's analytics surface insights for data-driven decisions — giving your team a starting point for smarter energy utilization.

Eco-Optimized
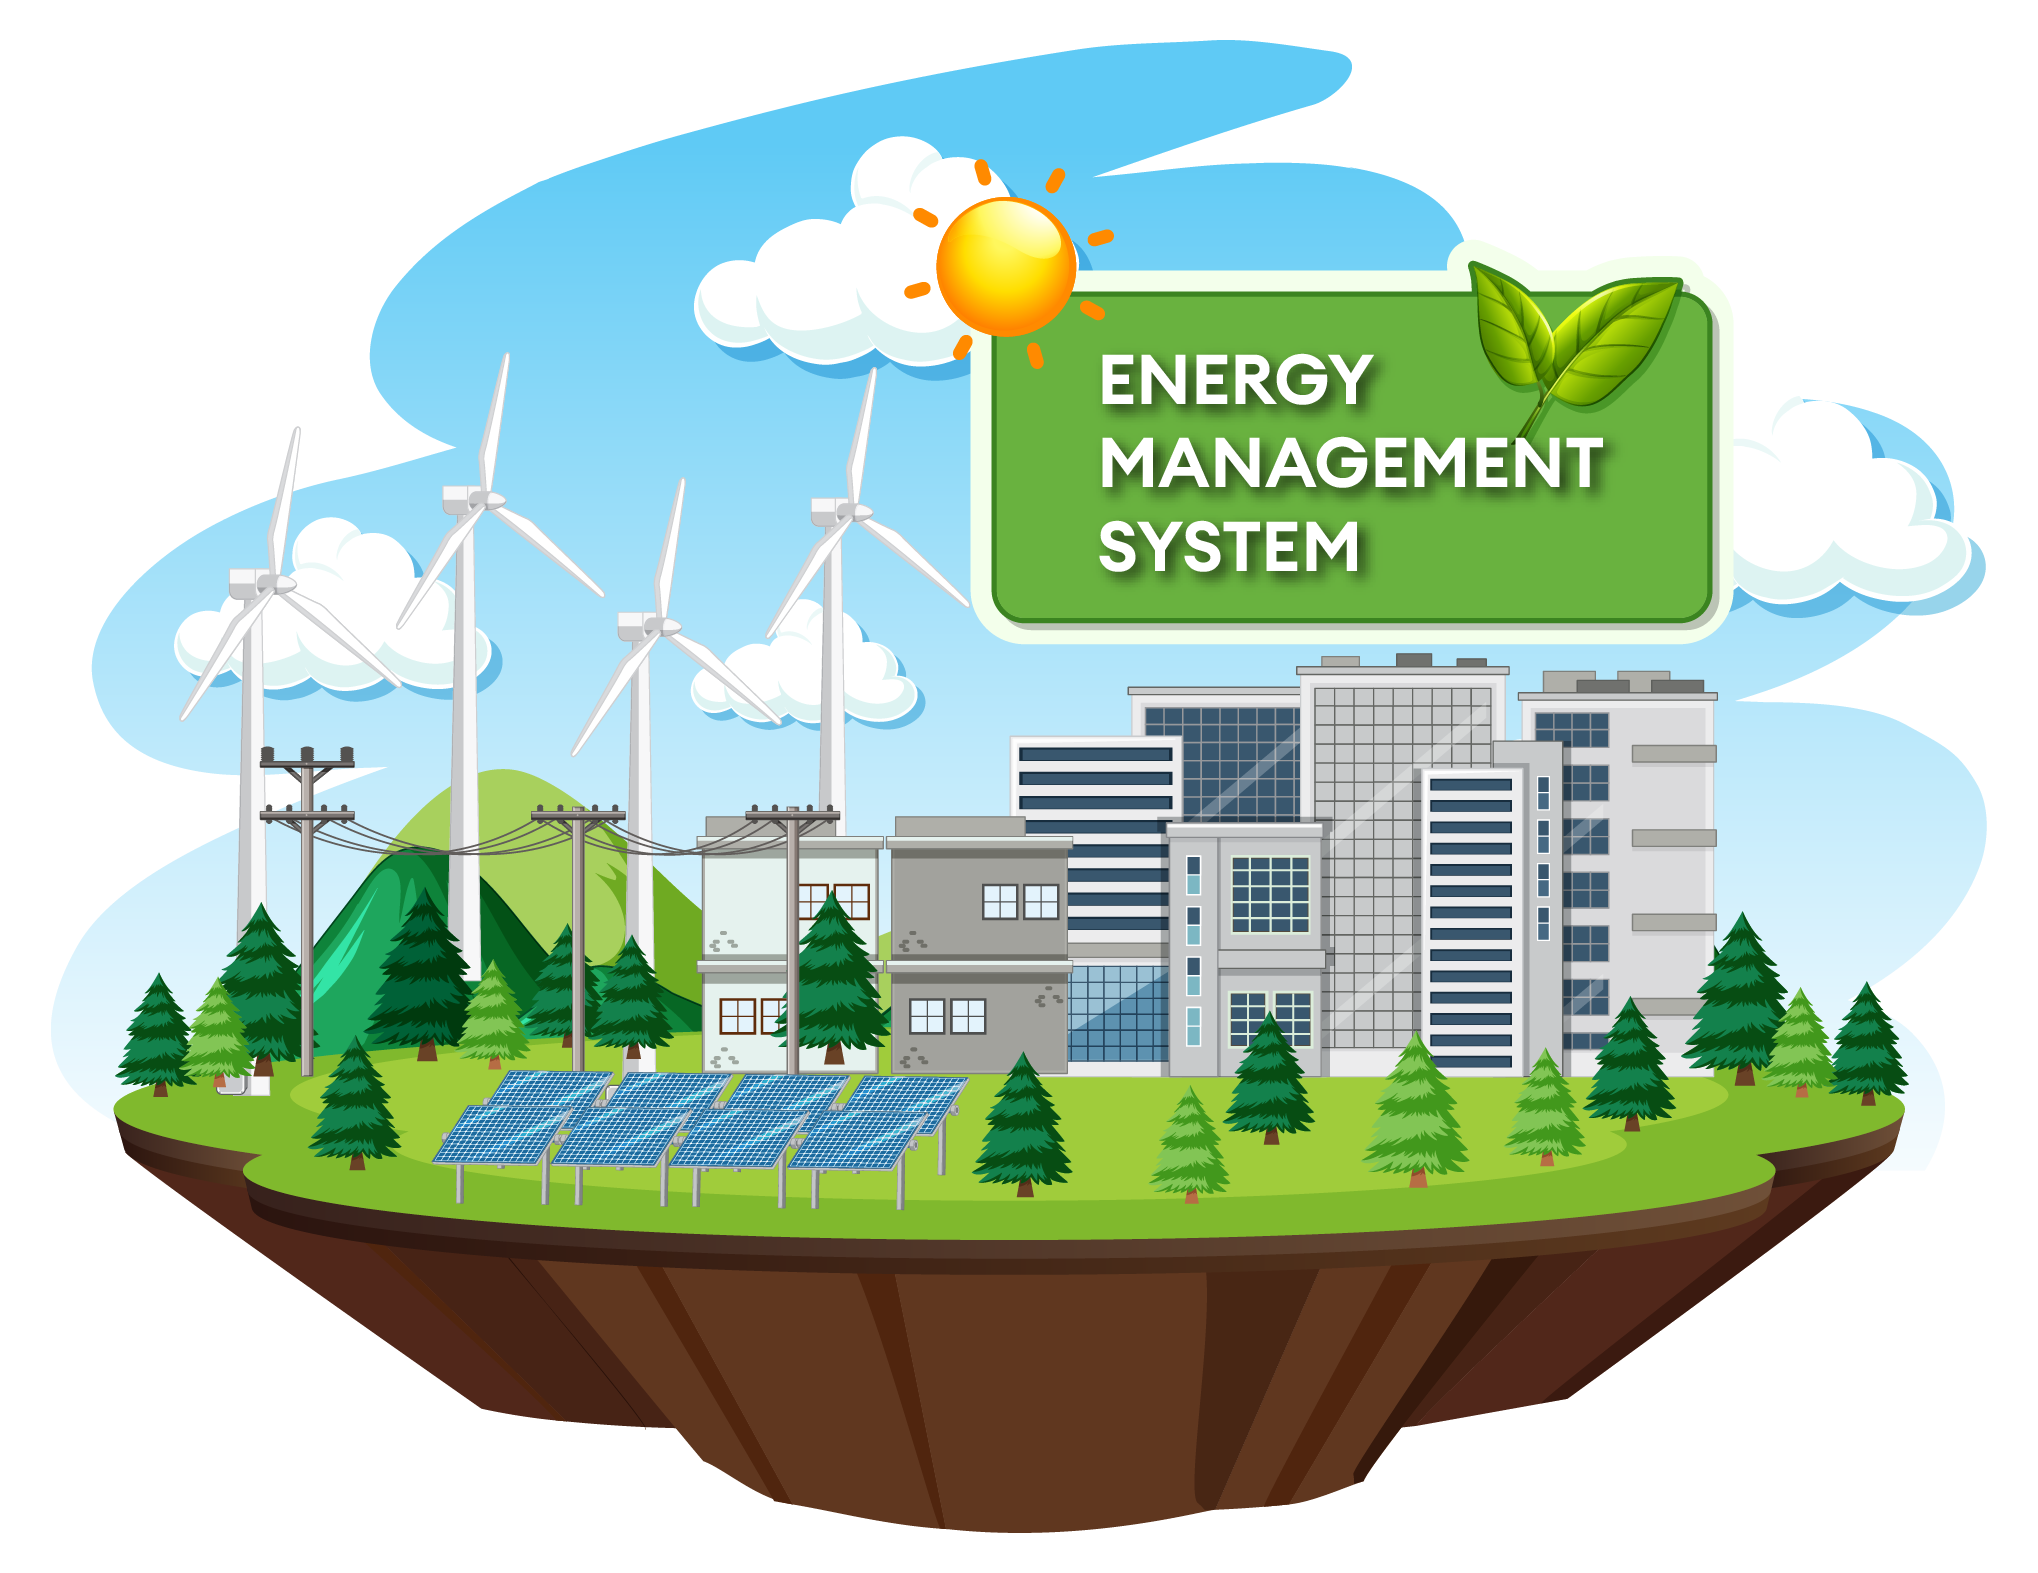
MonitEasy EMARS energy-saving illustration
30%Typical running cost share*
40%Avg. savings identified*
24×7Continuous monitoring
3Utilities in one view
How It Works

From Meter to Smart Decision

A seamless IoT pipeline that turns raw energy data into actionable recommendations that reduce costs and improve sustainability.

  1. 1

    Multi-Point Data Collection

    IoT-enabled energy meters connected via MODBUS/RS485 collect real-time consumption data from every machine, section, and utility point across the facility.

  2. 2
    📡

    MonitEasy Gateway Processing

    The MonitEasy Edge gateway aggregates meter data locally, applies threshold logic to detect anomalies, and transmits via 4G/Wi-Fi/Ethernet to the MonitEasy cloud.

  3. 3
    ☁️

    Cloud Analytics

    Data streams into the MonitEasy AWS platform, where analytics run continuously — detecting patterns, forecasting demand, and generating savings recommendations.

  4. 4
    📊

    Dashboard & Alerts

    Live dashboards on web and mobile display real-time KPIs. Threshold breaches trigger instant SMS and email alerts to up to 5 stakeholders simultaneously.

  5. 5
    📋

    M&V Reports

    Auto-generated monthly Measurement & Verification reports quantify savings achieved, support ROI validation, and outline recommendations for further optimization.

  6. 6
    🔄

    Continuous Optimization

    Analytics continuously learn from historical patterns — refining recommendations, anticipating peak demand, and supporting incremental efficiency gains over time.

Technical Specifications

System Specifications

MonitEasy EMARS is engineered for industrial environments — multi-protocol, and field-tested at 300+ customer sites.

MonitEasy EMARS technical specification — last reviewed August 2026.
ParameterSpecificationStatus
Protocol SupportMODBUS / RS485 / TCPSupported
Connectivity4G LTE / Ethernet / Wi-FiActive
Monitoring IntervalMinute-by-minute (24×7×365)Live
Sources MonitoredElectricity, Gas, WaterActive
Alert ChannelsSMS + Email (up to 5 recipients)Live
Dashboard AccessWeb + MobileActive
ReportingAuto-generated M&V monthly reportsEnabled
Cloud PlatformAWS-hostedActive
BMS / SCADA IntegrationDesigned to integrate, not replaceSupported
40% Potential Savings
Sample Dashboard View
Current Load
142 kW
Savings This Month
₹2.4 L
Active Meters
24 / 24
Cloud Status
Online
Alerts Today
0 Critical
Comparison

EMARS vs. monthly utility bill review

AspectMonitEasy EMARSMonthly bill review
Data frequencyMinute-by-minute, 24×7Once a month, after the fact
GranularityPer machine, section and utility (electricity, gas, water)Whole-site aggregate only
Anomaly detectionNear real-time alerts on threshold breachesNone — wastage discovered only in hindsight
ROI validationAuto-generated M&V reportsManual, if done at all
IntegrationConnects with existing BMS/SCADANot applicable

Smart Grid Intelligence

By providing a clear overview of energy consumption, EMARS is designed to help you optimize manpower allocation, so human resources can be directed to where they are most needed. This can reduce man-hours spent on manual checks and support broader operational improvements.

The system analyses patterns, identifies anomalies, and surfaces recommended actions based on historical trends. This supports a more proactive approach to maintenance, downtime reduction, and energy management strategy — all from the MonitEasy unified dashboard.

FAQ

Frequently asked questions

How much energy can EMARS help save?

EMARS is designed to help identify savings opportunities of up to 40%, based on aggregated results across MonitEasy's customer base. The actual figure for any specific facility depends on baseline consumption patterns, equipment age, and how recommendations are acted on — case studies with methodology are available on request.

What utilities does EMARS monitor besides electricity?

EMARS monitors electricity, gas, and water simultaneously through a single dashboard, giving facilities a unified view of utility consumption rather than separate systems for each.

Can EMARS integrate with our existing BMS or SCADA system?

Yes. EMARS supports MODBUS, RS485 and TCP protocols and is designed to integrate with existing Building Management Systems and SCADA platforms without requiring a full hardware replacement.

What is a Measurement & Verification (M&V) report in EMARS?

An M&V report is an auto-generated monthly document that quantifies energy savings achieved against a baseline, helping validate ROI and support decisions on further optimization measures.

How often does EMARS collect energy data?

EMARS is built for continuous, minute-by-minute monitoring, 24 hours a day, so consumption trends and anomalies are visible without gaps between readings.

How does EMARS generate its energy-saving recommendations?

EMARS analyses historical and real-time consumption patterns across connected meters to identify inefficiencies and anomalies, then surfaces recommended corrective actions through the dashboard for the facility team to review and act on.

MonitEasy Footer V1 — Precision Dark